Pandas-TA is a python 3 pandas library that contains more than 130 technical indicators that can be used to analyze any asset by using Open, High, Low, Close, Adj Close, Volume market information structure. You can download asset price history for the specified time interval using Yahoo! Finance API. To install the library, type:
pip install yfinance
Next, after importing yfinance library, pull asset price history using the following python code:
asset_history = yf.download(tickers=f"{ticker}", start="2021-01-01", end="2022-02-04", progress=False)
It is assumed that you have already installed pandas library:
pip install pandas
In order to install pandas-ta library type:
pip install pandas-ta
Next, import pandas-ta library:
import pandas_ta as pta
For the list of available technical indicators refer to pandas-ta documentation.
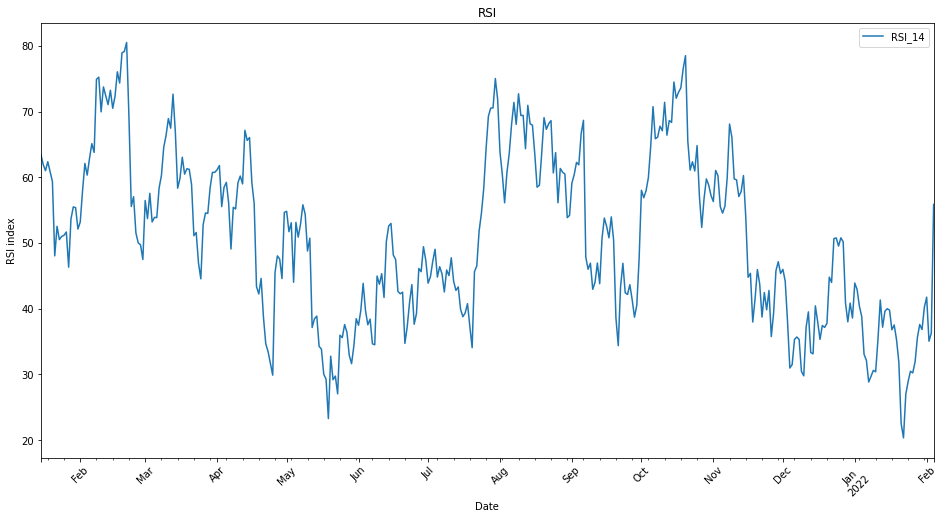
The following is the example how you can call RSI (Relative Strength Indicator):
pta.rsi(asset_history['Adj Close'],length=14)
To plot technical indicator you can utilize matplotlib library and the code:
rsi.plot(title = 'RSI', rot=45,figsize=(16,8), ylabel='RSI index')
To install matplotlib, you can type:
python -m pip install -U matplotlib
I hope this high level overview of pandas-ta python 3 library was helpful so you will spend less time coding and more time analyzing assets. You can view the complete code in the GitHub notebook.